Is This the Second Wave?
The number of new COVID-19 cases is rising quickly. So is the positive test rate. But to understand whether or not there's a second wave, you have to keep your eye on deaths.

The number of new cases doesn't look good. Here's the data as of Thursday morning. Let's look at the curve on the rolling 7-day average:

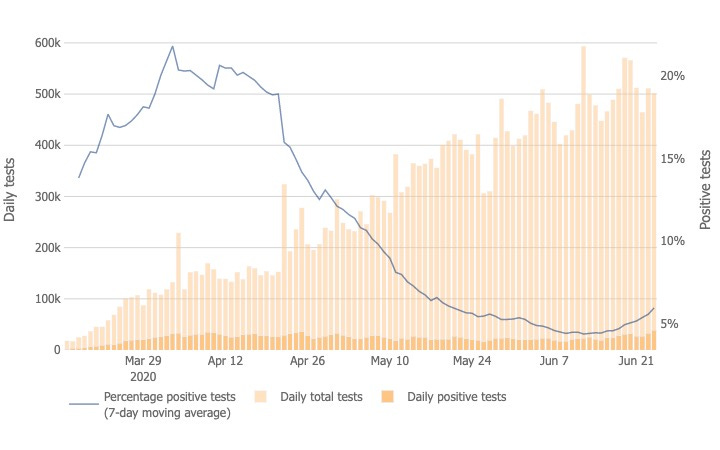
On the other hand, the number of tests performed daily has increased dramatically—which is very good. Have a look at the daily test numbers:

Yay testing!
This is why some people who hold high office are saying that the only reason we have more cases is because we're doing more testing.
That is one possible explanation.
Another possible explanation is that there are more infections out in the wild than there were three weeks ago.
If that were the case, then you would expect to see the percentage of positive tests going up and ruh-roh:

So the low point in our percentage of positive tests tracks almost exactly with our low point in daily new cases (that was right around June 10). And since then the percentage of tests coming back positive has gone upward at the same time that the number of new cases have gone upward.
Now, if you want to argue that this is all still just an artifact of testing, you could do that. You could say that there's selection bias going on and that suddenly we have a greater percentage of the infected population deciding to get tested. Which is why the positive test rate is increasing.
But that's a little thin.
The other explanation is that the actual real-world population of infections has grown.
Here is the thing about testing: We have two worlds.
The first world is the real world, in which people are either infected, or they are not. The problem with the real world is that it is impossible for us to see it while it's happening. Because the virus is invisible and the world is too big and moves too fast.
The second world is the shadow world of testing, which you can think of as an alternate reality that is closely—but not perfectly—based on the real world.
Getting a test doesn't change the base reality. Testing merely reveals an individual slice of reality and quantifies it for observers to see. Ideally, the world of testing tracks very closely with the real world and gives us a good picture of what the real world looks like.
But there are lots of variables and uncertainties. The picture testing gives you may be very close to reality, or may be a slightly warped version of reality.
The single best metric we have in terms of showing us what the real world looks like is death.
Because a certain percentage of people who contract the coronavirus will die from it. Can this percentage fluctuate depending on the risk profiles of the infected population and therapeutic advances? Yes.
But deaths are the metric that will most closely mirror the real-world status of infections.
There's just one problem with using deaths as your lodestar: They are a trailing indicator of infections.
If the real-world number of infections starts to rise—meaning that we are not just seeing more infections in the testing world for whatever reason—then we will eventually see a corresponding number of deaths. But we won't see it for three or four weeks.
Right now our daily death totals are looking better. Which is to say that the rolling average is 700 deaths per day and the direction of the trend is downward.
The problem is that these death numbers are only confirming the decline in real world infections that we started seeing in the testing world back in early June.
The current daily death totals don't tell us anything about the state of the pool of infections today.

If there is a second wave, then by mid- to late July we're going to see the daily death numbers start to trend back upward.


