Race and Place: How Community Disparities Affect Inequality
A growing body of social science evidence shows that disparities in neighborhoods cause disparities in life chances and individual outcomes—and the effects are felt across generations.

Racial inequality in the United States cannot be understood—let alone meaningfully addressed—without grappling with this fact: Decades after the end of Jim Crow, American neighborhoods remain highly segregated and the disparities among communities are perpetuated across generations. The characteristics of a child’s community—especially during his or her earliest years—have a major role in shaping that child’s life chances. The fact that black and white children are raised in such different neighborhoods is both a cause and an effect of racial inequality.
In recent years, journalists, historians, and commentators have slowly begun to pay more attention to the ways in which “the concentration of poverty has been paired with a concentration of melanin,” as Ta-Nehisi Coates put it in his 2014 Atlantic article that brought national attention to neighborhood “redlining” practices. And social scientists have offered a significant amount of data to make this complicated issue more comprehensible.
Princeton professor Patrick Sharkey, for instance, has demonstrated that for children born from 1955 through 1970, nearly half (49 percent) of black children in middle-to-high-income families lived in high-poverty neighborhoods, compared with only 1 percent of white children in middle-to-high-income families. And in a later cohort, children born from 1985 through 2000, 78 percent of all African-American children grew up in highly disadvantaged neighborhoods, compared with only 5 percent of all white children. So not even relative wealth is a guarantee of escape from a highly disadvantaged neighborhood for African-American families, whose children are then forced to experience the effects of growing up in one.
What does this mean in concrete terms? The data “strongly suggests,” Sharkey says, “that children’s life chances—including their cognitive development, health, educational attainment, and economic mobility—are heavily influenced by the communities where they grow up.” Black Americans, he notes, “are more likely to attend lower-quality schools, be exposed to environmental toxins, be exposed to crime and violence, and to have fewer employment opportunities in early adulthood.” These inequalities “accumulate over time and across generations.”
Similarly, Harvard University’s Robert Sampson notes that the “spatial isolation of African Americans produces exposure to concentrated, cumulative, and compounded disadvantage, constituting a powerful form of racial disparity.”
The characteristics of the communities where children are raised play a crucial role in their life chances as adults, regardless of the children’s individual characteristics or those of their families. A variety of community characteristics are important, including:
the economic (such as income and wealth) and social (such as social networks) resources of residents;
predominant family structures;
community institutions (such as schools, police departments, childcare providers, healthcare providers, and churches);
levels of income inequality and racial segregation;
prevalence of violence and gangs;
adult role models and mentors, social norms;
social cohesion (such as levels of trust and support);
peer networks;
environmental burdens;
labor markets;
marriage markets;
stability of neighborhood populations; and
characteristics of nearby neighborhoods.
And children raised in communities that are disadvantaged in the above measures tend to have worse life outcomes in these ones:
cognitive development,
academic performance,
educational attainment,
economic productivity,
social mobility,
substance abuse,
sexual behavior,
teen pregnancy,
mental and physical health,
aggression and violence,
deviance and criminal involvement, and
criminal victimization.
For present purposes, let’s focus on the way community characteristics affect two of these measures of individual outcomes: social mobility and violence.
Communities and Social Mobility
Writing in the New York Times in 2015, University of Michigan economist Justin Wolfers described two studies from the past decade of the way neighborhoods affect life chances as “the most powerful demonstration yet that neighborhoods—their schools, community, neighbors, local amenities, economic opportunities and social norms—are a critical factor shaping your children’s outcomes.”
Some background: Back in 1987, the IRS introduced an anti-fraud measure that required American taxpayers to start listing the Social Security numbers of all dependents they claimed on their tax returns. This requirement had the unintended effect of making possible for researchers to link millions of children with their parents’ tax records for the first time. The data the IRS started collecting then had the potential to vastly improve our understanding of social mobility.
Realizing this opportunity, Harvard economist Raj Chetty and his colleagues responded to a research solicitation by the IRS in 2011. Using an anonymized version of the IRS data, Chetty and his colleagues published several studies that provided strong evidence for the claim that communities play a vital role in one’s chances of mobility—a role that is virtually unaffected by the characteristics of the individual or his or her family.
The researchers made all the data available to the public, so anyone can explore it using the “Opportunity Atlas” tool, which provides both granular information about individual neighborhoods and larger synthetic reports about the opportunity profile of several cities. (We highly recommend exploring it yourself.)
The public availability of the data allows researchers—working with the IRS sample of over 20 million people born between 1978 and 1983, as well as U.S. Census data—to analyze three important things: (a) the characteristics of the areas where people grew up, including things like educational attainment, income, labor market conditions, poverty, racial segregation, school quality, single parenthood, and social capital; (b) their adult outcomes in their mid-thirties, including measures like income, college graduation, employment, incarceration, marriage, social mobility, and teen childbirth; and (c) the statistical associations between the characteristics of their childhood communities and their adult outcomes.
So what does the data tell us? That an American child’s likelihood of being upwardly mobile varies considerably according to where they are raised. As the table below illustrates, in some U.S. counties, virtually no low-income men climb into the top 20 percent of American income earners, while in others, around 45 percent of low-income men do so. That is an enormous difference.
Upward Mobility for Low-Income Men Across U.S. Counties
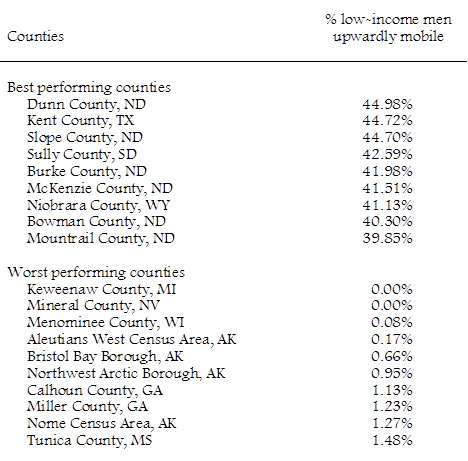
“Low-income” defined as the 25th percentile. “Upward mobility” defined as earning a household income in your mid-thirties in the top 20 percent of the national income distribution. (Source: Authors’ calculations based on Opportunity Insights [2022] data.)Large differences exist whether one uses census tracts, counties, or commuting zones as the unit of analysis. We can use the states where we teach as examples. In Pittsburgh, Pennsylvania, not far from Shippensburg University where Lawrence Eppard teaches, a 5-to-10-minute car ride will take you from a census tract with a 49 percent upward mobility rate for low-income men to a tract with less than 1 percent upward mobility. In Philadelphia, there are adjacent tracts with drastic differences (42 percent vs. 1 percent). In Salt Lake City, not far from Brigham Young University where Erik Nelson teaches, there are similar inequalities (38 percent vs. less than 2 percent)—just as there are in cities across the country.
Why such large variations in social mobility? While there are a variety of community characteristics that affect the likelihood that children raised in an area will be upwardly mobile, five of these characteristics stand out in the literature as being particularly powerful: single parenthood, social capital, school quality, income inequality, and racial segregation.
Association Between Single Parenthood and Mobility Across Counties
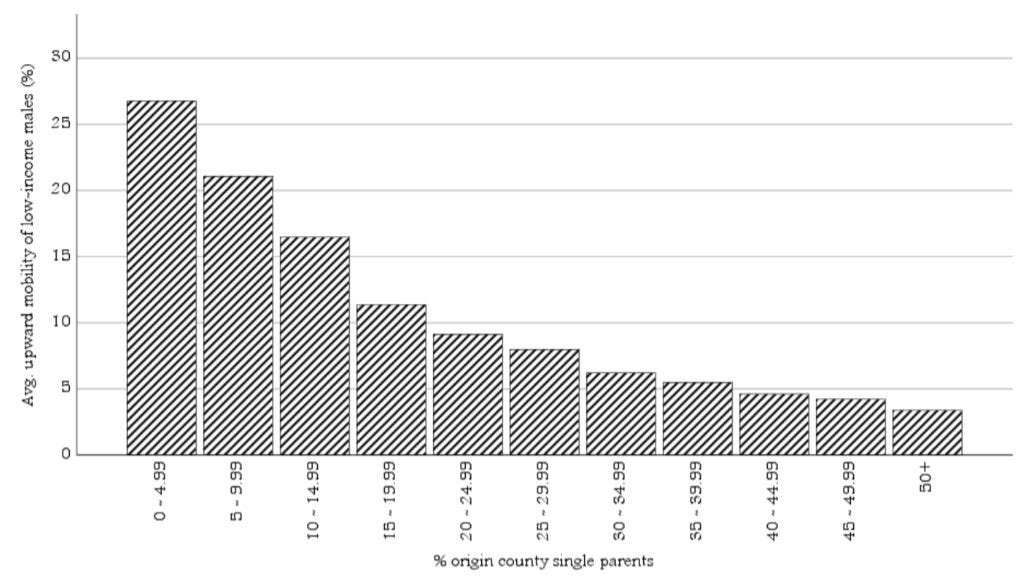
(Source: Authors’ calculations using Opportunity Insights [2022] data.)And while we know that children of single parents have a harder time educationally and economically than children of married parents, family structure also matters at the community level: The prevalence of single parenthood in a community is actually one of the community characteristics that most strongly correlates with mobility.
To demonstrate the influence of widespread single parenthood in a community independent of one’s own family structure, Chetty and his colleagues examined two different groups of children: After including all children in their initial sample and finding their mobility was strongly associated with the level of single parenthood in their community, the researchers limited their sample to only children who lived in married-parent households—and the result was the same. Mobility among children who come from married-parent households was strongly associated with single parenthood in their community. In other words, even children in households with married parents were less likely to be upwardly mobile if many families in their community were headed by a single parent.
One of the many virtues of the IRS data is that the information allows researchers to examine the relationship not only between communities and mobility, but between communities and a variety of other important adult outcomes, as well. College graduation, income, marriage, risk of incarceration, teen birth rates: The statistical relationships remain strong across a number of these measures.
The figure below, for instance, presents a visualization of the relationship between the percentage of residents in a community who are single parents and the marriage rate for low-income males raised there. The correlation is strong, and it remains strong even when controlling for other community variables like poverty.
Association Between Single Parenthood and Marriage Across U.S. Counties

The correlation (-0.72; p < .001) is considered strong. Cohort includes 20.5 million Americans born 1978-1983. “Low-income” defined as the 25th percentile. Single parenthood rate is the percentage of households in their county of origin (average of 1990 and 2000 rates) with children headed by a single parent. Marriage rates measured when males from these counties reached their mid-thirties. (Source: Authors’ calculations using Opportunity Insights [2022] data.)
Communities and Violence
Community characteristics have major implications that can be traced in another important measure of individual outcomes: violence. The risk that individuals will commit or be a victim of violence increases significantly if they are raised in a disadvantaged family and/or among concentrated disadvantage in their community. (“Concentrated disadvantage” refers to areas where multiple dimensions of disadvantage exist at the same time—not just poverty but also things like high levels of unemployment, public assistance, single parenthood, and racial segregation, among others.)
Studies show that violent crime tends to be concentrated within small social networks as well as geographic “hot spots” or “micro places”—a phenomenon sometimes referred to as the “law of crime concentration.”
In one study of Boston data from an almost thirty-year period, for instance, more than half of all incidents of gun violence could be attributed to fewer than 3 percent of micro places in the city. Another study in the same city found that about 85 percent of gunshot injuries occurred within a single network of people, and this network represented less than 6 percent of the city’s population. According to one analysis, between 59 and 84 percent of homicides in Oakland in 2012-13 involved members of violent groups, the total membership of which represented just 0.3 percent of the city’s population. In New Orleans, less than 1 percent of the city’s population was involved in most murders.
As criminal justice scholar David Kennedy notes, “In what we think of as the ‘most dangerous places,’ very, very few people are actually at any meaningful risk for violent offending. . . Most of the folks in those places are in no way a part of the problem.”
We have conducted several analyses that show the clustering of homicides within areas of concentrated disadvantage across several U.S. cities. Our maps of St. Louis, Missouri and East St. Louis, Illinois, for instance, illustrate this phenomenon clearly:
Homicides and Neighborhood Disadvantage in St. Louis, Missouri and East St. Louis, Illinois
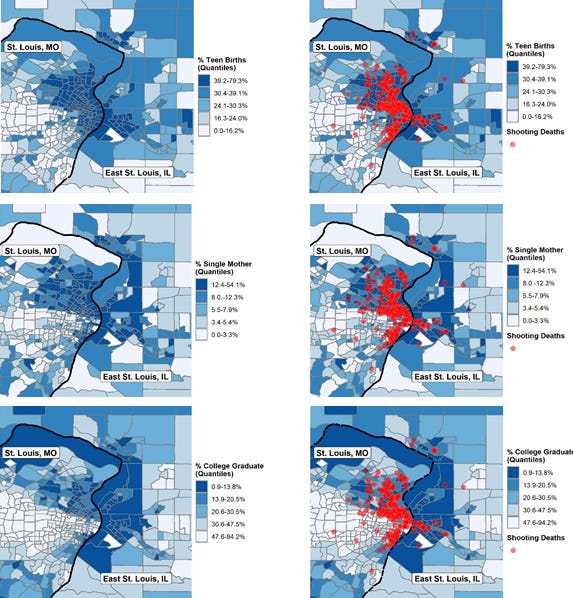
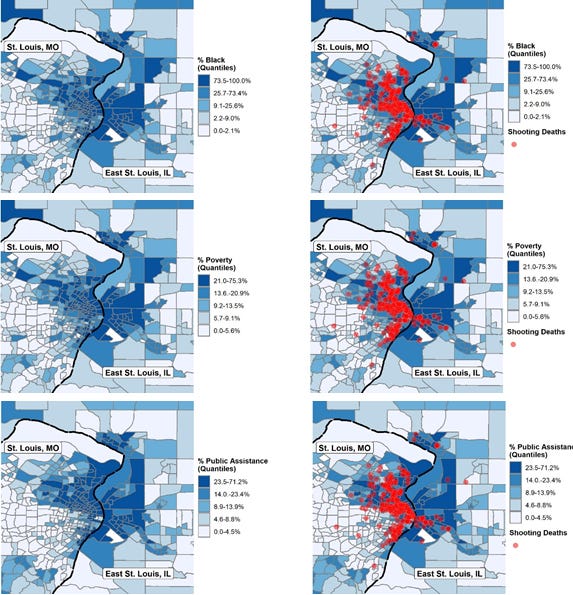
In the year of analysis (2021), 270 shooting homicides occurred in the St. Louis metro area. (Source: Authors’ calculations using U.S. Census and St. Louis Post-Dispatch data.)
In one study of the way communities affect an individual’s likelihood of being involved in crime, researchers compared the delinquency rates of young black and white men based on where they lived. When the comparison was made without considering the differences in where they lived, the black males were more frequently and more seriously delinquent. But when researchers compared only black and white males who did not live in disadvantaged neighborhoods, differences in rates of delinquent behavior between the two groups practically disappeared:
Race, Neighborhoods, and Frequent Serious Delinquency
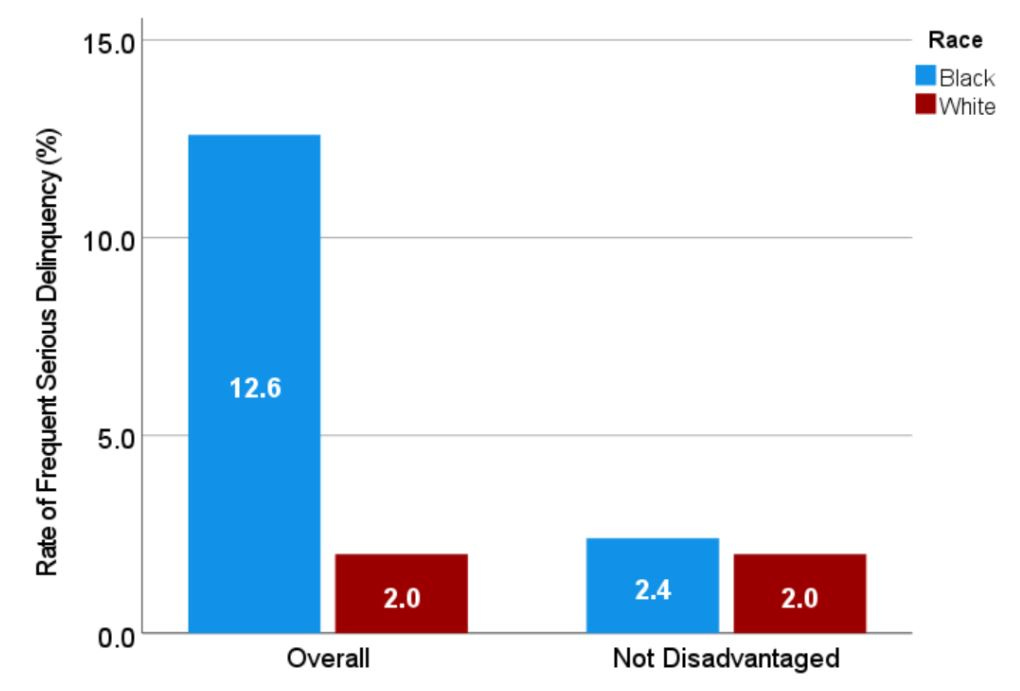
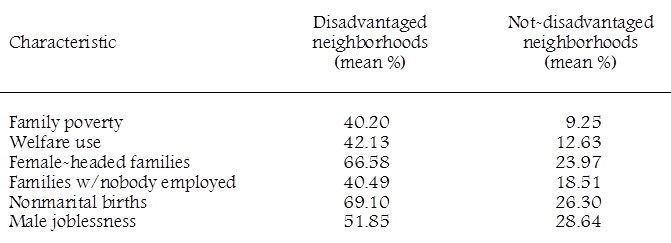
“Frequent serious delinquency” defined here as the percentage committing six or more serious delinquent acts. “Disadvantaged neighborhoods” are defined by a combination of family poverty, public assistance, female-headed families, families with no one employed, nonmarital births, and male joblessness—see table below. (Source: Peeples and Loeber 1994.)
An account of what constituted a disadvantaged neighborhood in this study:
(Source: Peeples and Loeber 1994.)
As these illustrations make clear, race did not cause these differences in delinquency. It was rather an indication of which group was raised in disadvantaged social conditions and which was not. The average percentage of residents who were African American in the disadvantaged neighborhoods in the study was 84 percent, compared with only 18 percent for the neighborhoods that were not disadvantaged.
As Robert Sampson notes, “racial disparities in violent crime rates [are] attributable in large part to the persistent structural disadvantages disproportionately concentrated in African American communities.” Summarizing another recent study, he adds that “race is not a direct cause of violence, but is rather a marker for the cluster of social and material disadvantages that both follow from and constitute racial status in America.”
All this data suggests that if you segregated Americans into disadvantaged neighborhoods on the basis of some other characteristic—left- or right-handedness, for instance—then that characteristic, handedness, would come to take on the association with violence that is currently attached to race. In this scenario, anybody who didn’t know any better might call crime a “left-handed” or “right-handed” problem. (This is sometimes called the “racial invariance thesis.”)
And, causes aside, it should also be noted that the number of African Americans who actually commit violent crimes is extremely small. For example: There were 4,078 arrests of African American perpetrators for murder in the FBI’s most recent yearly statistics. This represents about 0.00009 percent of the black population in the United States.
What Can Be Done?
There are numerous options available for addressing the disparities between American communities that drive racial inequality, including investing in struggling areas and investing in the individuals living in them. We could also help individuals move to areas of greater opportunity.
These options’ potential for success can be illustrated with reference to an experiment conducted by the U.S. Department of Housing and Urban Development in the 1990s. Between 1994 and 1998, approximately 4,600 families living in high-poverty public housing projects in five major U.S. cities were randomly assigned to one of three groups as part of the Moving to Opportunity (MTO) experiment. Members of one group were given a subsidized housing voucher they could use to move to a neighborhood in a census tract with a poverty rate below 10 percent. Members of a second group were offered a standard housing voucher with no requirements about where they moved. Members of the third group, the control group, remained in public housing for comparison.
The goal of the experiment was to determine if the participating families that moved to better neighborhoods experienced better economic and health outcomes. The first analyses of the experiment’s results were not promising. This led many to question how important communities really were in determining individual outcomes, and whether putting effort into helping struggling communities was worth it.
A recent reanalysis of the data, however, tells a different story. Rather than looking at how all dependents—whether toddlers or teenagers—fared overall, the researchers examined different subgroups of children by age. They found that teenagers who moved to a lower-poverty neighborhood as part of MTO did not appear to improve their life chances, but that young children who moved experienced significant improvements.
Specifically, the results of the study suggested that moving elementary school-age children out of public housing and into a lower-poverty area can improve their chances of graduating college, raise their total lifetime earnings by hundreds of thousands of dollars, and lower their chances of becoming single parents. These are the kinds of gains that could be felt across multiple generations. The kicker: Researchers estimated that the additional tax revenues associated with the participants’ increased earnings offset the extra costs of the voucher above the cost of public housing.
In light of this reanalysis of the MTO study, and in combination with other major developments in the research in recent years, Wolfers argued in his 2015 New York Times article that:
Each of these analyses is quite persuasive, but none, taken alone, is a slam dunk. . But while you may doubt one piece or other of it, it is virtually impossible to dismiss it all. . . . [T]he relentless accumulation of evidence is now so compelling that I believe it will sustain a new consensus. That consensus, simply stated, is that place matters. This puts the issue of fixing our failing neighborhoods squarely on the political agenda.
If place is as important for children’s success as the evidence indicates, then we cannot hope to truly address racial inequality in the United States without addressing the stark differences between our communities.


